Debugging Robot
Debug functionality is unique way of checking what is happening during tests execution. It works similar as debug functionality in most of programming languages - it allows to track execution of a program for checking unwanted behavior either on tests side or in tested software.
- Warning
- Avoid making changes in scripts/suites when debugging as you may encounter problems with finding proper code elements to suspend on.
- Note
- Step-into works only for Robot written Keywords. If you wish to step-into Python Keywords, check Debug Robot and Python scripts help content.
Basics
In order to work with debugger please save any unsaved files beforehand. Debugging is done inside Debug perspective however you don't need to activate it as by default RED will ask if you want to activate it once the tests execution suspends. The same is true for editors: debugger will open an editor with currently executing file when suspended.
Execution may be suspended due to couple of reasons:
- user requested suspend - this is done by pressing Suspend button as described in Controlling execution topic,
- breakpoint hit - whenever breakpoint (a place in code) defined by the user have been hit,
- erroneous state suspension - debugger may go into erroneous state. This may happen when running tests locally (for example when test uses unknown keyword) however it is more probable in remote execution when local code does not exactly match remote code. By default RED will ask if execution should suspend but this behavior is configurable in preferences,
- end of step - when suspended due to one of reasons above user may ask debugger to perform a step (e.g. step over current keyword call), such step will result in another suspension just after current instruction.
For more information about suspending execution and working with it please refer to Suspended execution topic.
Starting debugging session
Place breakpoint in RobotFramework executable code
First thing when working with debugger is to place at least one breakpoint. This allows RED to pause the execution and activate stepping options. You may add breakpoint inside the editor at Source page either by double clicking on left-side ruler, choosing Toggle breakpoint option from context menu of this ruler or by hitting Ctrl+Shift+B shortcut (this will add breakpoint for the line in which the caret is located). When successful, blue ball icon will appear next to it and new breakpoint entry will be visible in Breakpoint view.
Start Debug
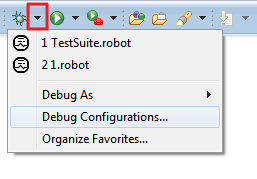
To start debugging you need to launch the configuration in debug mode. For example by clicking on "green bug" icon at the top toolbar:

Limiting test cases to be debugged
You may edit the launch configuration in order to limit test cases which should be executed in your debug
session. Open
Run -> Debug Configurations... dialog and choose which cases should be executed:
